Designer is a graphical web-based BPMN2 editor. It allows users to model and simulate executable BPMN2 processes. The main goal of Designe is to provide intuitive means to both technical and non-technical users to quickly create their executable business processes. This chapter intends to describe all feature Designer offers currently.
Designer targets the following business process modelling scenarios:
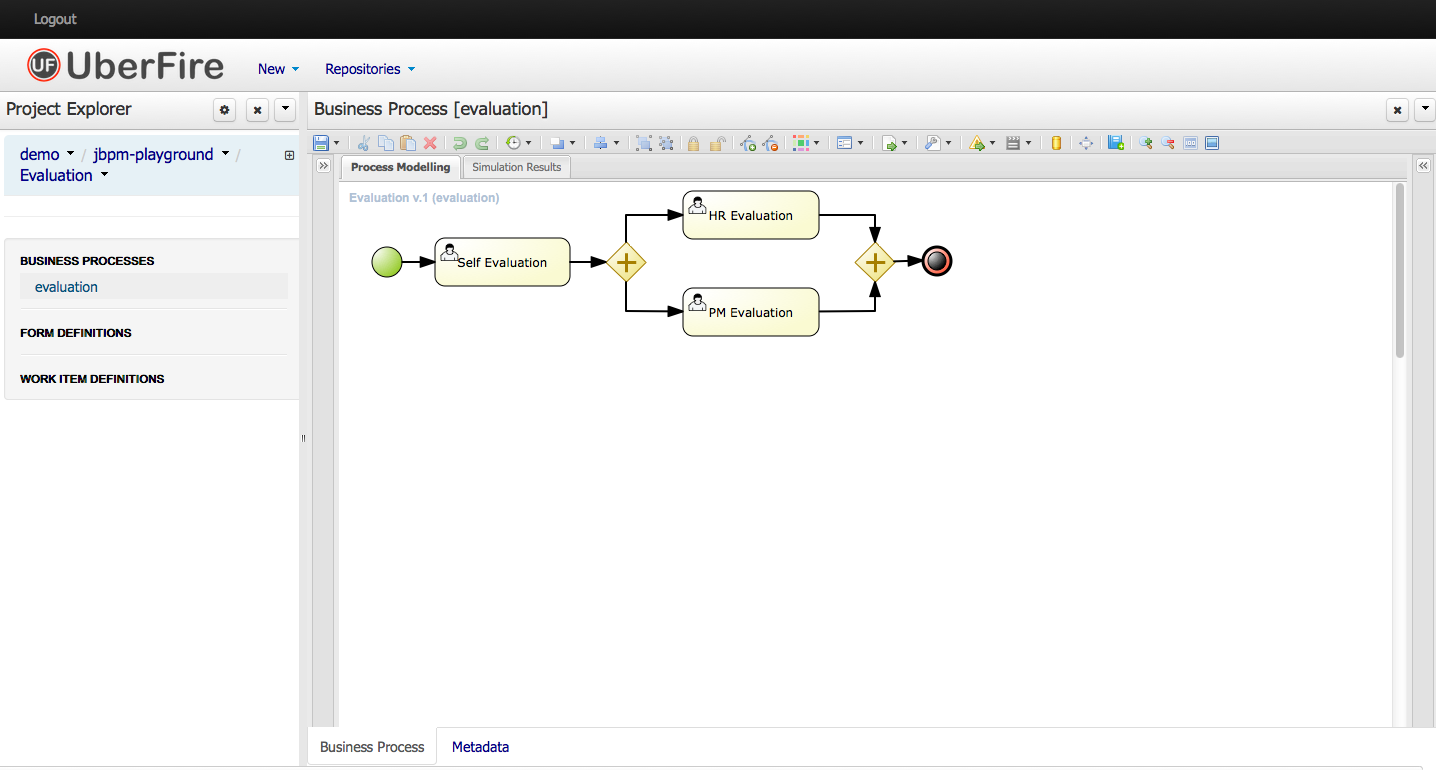
View and/or edit existing BPMN2 processes: Designer allows you to open existing BPMN2 processes (for example created using the BPMN2 Eclipse editor or any other tooling that exports BPMN2 XML).
Create fully executable BPMN2 processes: A user can create a new BPMN2 process in the Designer and use the editing capabilities (drag and drop and filling in properties in the properties panel) to fill in the details. This for example allows business users to create complete business processes all inside a a browser. The integration with Drools Guvnor allows for your business processes as wells as other business assets such as business rules, process forms/images, etc. to be stored and versioned inside a content repository.
View and/or edit Human Task forms during process modelling (using the in-line form editor or the Form Modeller).
Simulate your business process models. Busines Process Simulation is based on the BPSIM 1.0 specification.
Designer supports all BPMN2 elements that are also supported by jBPM as well as all jBPM-specific BPMN2 extension elements and attributes.
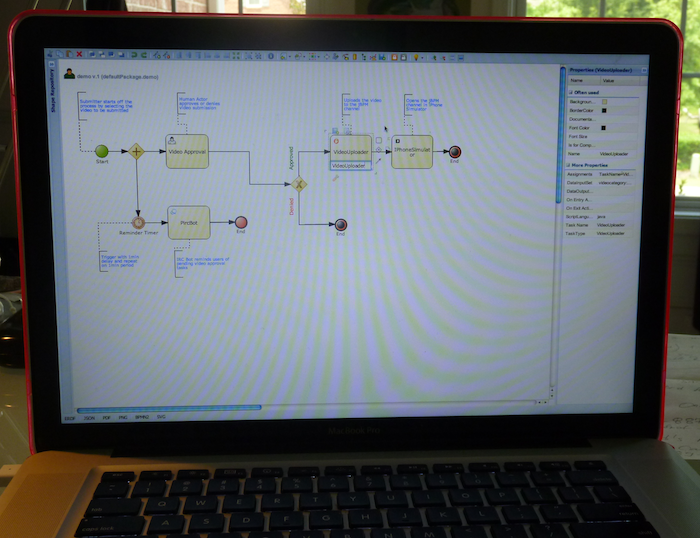
Designer UI is composed of a number of sections as shown below:
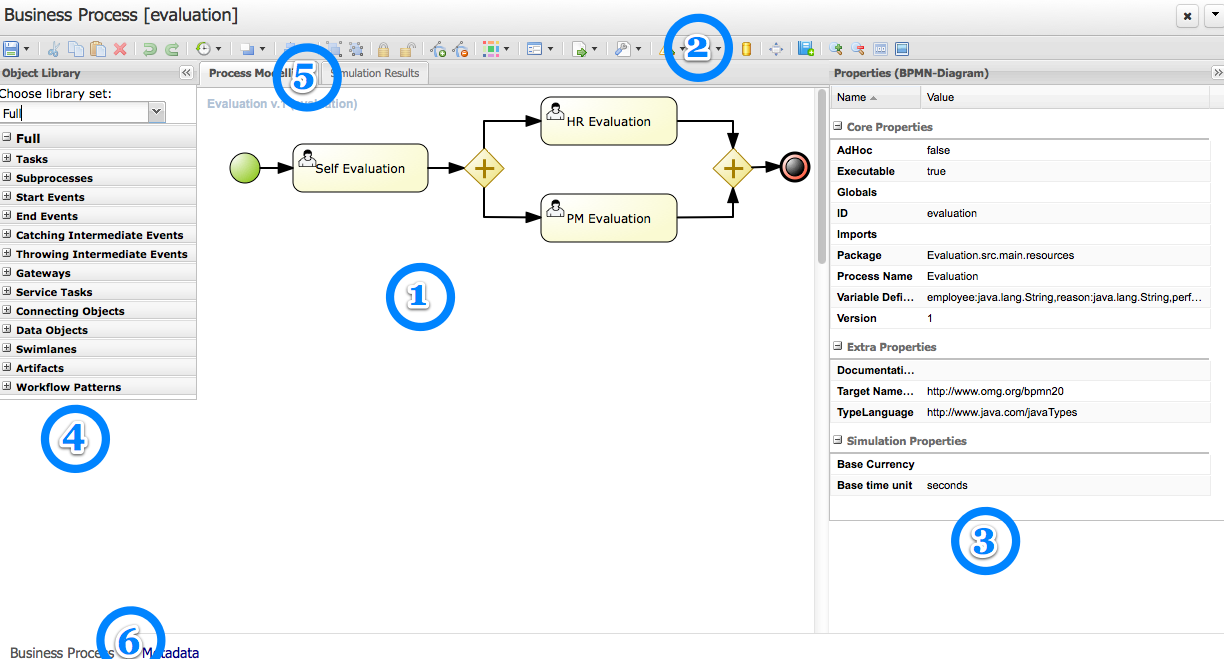
(1) Modelling Canvas - this is your process drawing board. After dropping different shapes onto the canvas, you can move them around, connect them, etc. Clicking on a shape on the canvas allows you to set its properties in the expandable Properties Window (3) (as well as create connecting shapes and morph the shape into other shapes).
(2) Toolbar - the toolbar contains a vast number of functions offered by Designer (described later). These includes operations that can be performed on shapes present on the Canvas. Individual operations are disabled or enabled depending on what is selected. For example, if no shapes are selected, the Cut/Paste/Delete operations are disabled, and become enabled once you select a shape. Hovering over the icons in the Toolbar displays the description text of the operation.
(3) Properties Panel - this expandable section on the right side of Designer allows you to set both process and shape properties. It is divided in four sections, namely "Core properties", and "Extra Properties, "Graphical Settings", and "Simulation Properties" are is expandable. When clicking on a shape in the Canvas, this panel is reloaded to show properties specific to the shape type. If you click on the canvas itself (not on a shape) the section shows your general process properties.
(4) Object Repository Panel - the expandable section on the left side of Designer shows the jBPM BPMN2 (default) shape repository tree. It includes all shapes of the jBPM BPMN2 stencil set which can be used to assemble your processes. If you expand each section sub-group you can see the BPMN2 elements that can be placed onto the Designer Canvas (1) by dragging and dropping the shape onto it.
(5) View Tabs - currently Designer offers functionality tabs for Process Modelling and Simulation. Process Modelling is the default tab. When users run process simulation, its results are presented in the Simulation tab.
(6) Info Tabls - On the bottom Designer shows two different Info tabs. The Business Process tab includes the process modeling while the Metadata tab displays the process metadata such as created by and last modified information.
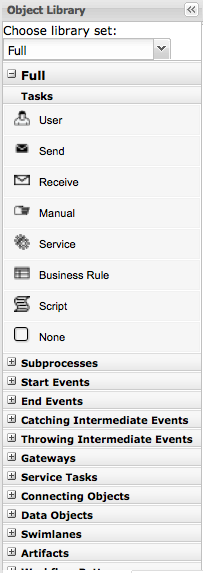
The Object Repository panel provide means for users to select and drag/drop BPMN2 shapes onto the modelling canvas. Shapes are divided into sections as shown below:
Once a shape is dropped onto the canvas users have a much faster way of continuing modelling without having to go back to the Object Repository panel. This is realized through the shape morphing menu which is presented when a shape on the drawing canvas is clicked on. This menu allows users to either select a connecting shape (next shape) or morph the selected node into another node type. In addition this menu includes means to store the shape name as a dictionary item (explained later), view the specific BPMN2 code of the selected shape, as well as create/edit the task form (in the case of user tasks only).
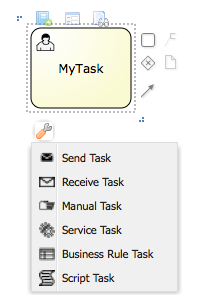
When connecting shapes Designer applies connection rules that follow the BPMN2 specification. The connection shapes presented in the morphing menu only show shapes that are allowed to be connections. Similarly same rules are applied when dropping a shape from the Object Library from the canvas and trying to connect an existing shape to it. Additional connection rules for boundary events are also available (explained later) and applied when for example moving an intermediate event node onto the edge of a task node.
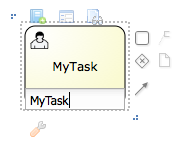
Users can give names to every shape on the drawing canvas. This is done by double-clicking onto the shape as shown below.
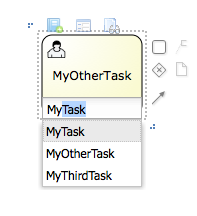
The name of a shape can be pulled from the Process Dictionary. If terms are set up in the dictionary, auto-complete can be used for the node names:
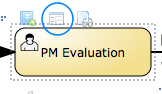
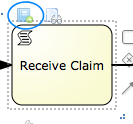
Designer also shows three buttons on top of a clicked shape as shown below.
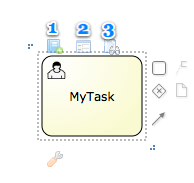
These include:
(1) Add To Dictionary - this option allows users to add the name of the task to the Process Dictionary (explained in more details later)
(2) Edit Task Form - allows users to create/edit the Task Form. This option is only available for User Tasks
(3) View shape sources - shows the BPMN2 for this particular shape only.
The section should get you started with creating simple business process models by dragging/dropping BPMN2 shapes onto the drawing canvas. Next sections will dive deeper into many other aspects of Designer.
The Designer toolbar contains many different functions which can be used during process modelling.

We will now go through each of the buttons in the Designer Toolbar and give a brief overview of what it does.
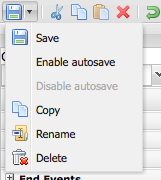
(1) Save - allows users to save, copy, rename and delete the business process model. In addition users can turn on auto-save which will automatically save the business process within a defined time interval.
(2) Cut - enabled when a portion of the model is selected.
(3) Copy - enabled when a portion of the model is selected.
(4) Paste - paste the copied portion of the model onto the drawing board.
(5) Delete - enabled when there is a portion of the model is selected and removes it.
(6, 7) Undo/Redo - undo the last performed operation on the drawing canvas.
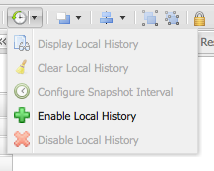
(8) Local History - local history allows continuous storage of your business process onto your browsers internal storage. Stored version of the business process can persist internet outages or browser crashes so your work will not be lost. This feature is disabled by default and must be enabled by users. Once local history has been enabled users are able to view all previously stored snapshots of their business model, clear local history, configure the snapshot interval, or disable local history. Note that local history will only take a snapshot of your business process on the set storing interval if there were some changes done in the model. If at the end of the snapshot interval Designer detects that there were no changes since the last local history save, no new snapshot will be created.
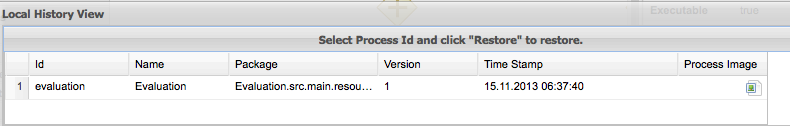
The Local History results screen allows users to select a stored snapshot of the model and
view its process image, and restore it back onto their drawing board.
(9) Object positioning - allows users to position one or more nodes in the business. Note that at last one shape must be selected first, otherwise these options are disable. Contains options "Bring to Front", "Bring to back", "Bring forward", and "Bring Backward"
(10) Alignment: enabled when a portion of the model is selected. Includes options "Align Bottom", "Align Middle", "Align Top", "Align Left", "Align Center", "Align Right", and "Align Same Size".
(11, 12) Group and Ungroup - allows grouping and ungrouping of selected shapes on the drawing board.
(13, 14) Locking and Unlocking - allows parts of the business model to be locked and unlocked. Locked parts of the model cannot be edited (visual display and properties are both locked). Locked nodes are displayed in a light blue color. This feature fosters collaboration of process modelling by allowing users to set parts of their model as "completed" and preventing any further changes to that portion. Other parts of the model can continue to be edited.
(15, 16) Add/Remove Docker - this allows users to add or remove Dockers, or edge points, to sequence flows in the model. Enables when a sequence flow (connector) is selected. It allows users to create very customized connection points from one shape to another. Users can add and remove as many dockers as they would like on a single sequence flow.
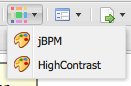
(17) Color Themes - Colors are a big part or process modelling as they help with expressing intent as well as help allowing visually impaired users to better view the model. Designer provides two default color themes out of the box named "jBPM" and "High Contrast". The jBPM theme is the default theme used for all new business processes created. Users can switch color themes and the changes will be applied to all nodes that are currently on the model, as well as any new shapes added. Users have the ability to add new custom color themes by adding their own definitions in the Designer themes.json file. Color theme selection is persisted over browser close or possible crash/internet loss.
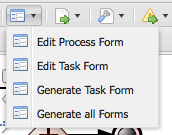
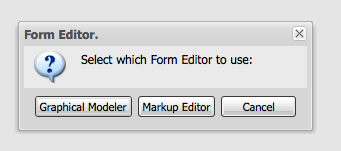
(18) Process and Task forms - here users have the ability to generate/edit process and task forms. When no user task is selected the default enabled options are "Edit Process Form" and "Generate all Forms". Generate all forms will apply the current model information such as process variables, data objects, and the user tasks data input/output parameters and associations to generate default executable input forms. Upon editing a process and task form, users have the choice between two form editors, the jBPM Form Modeler, and the Designer in-line meta editor. The Designer meta editor is targeted more to technical users as it is text based with the ability for live preview. When the user selects an user task in the model, the "Edit Task Form" and "Generate Task Form" options are enabled which allow users to edit the particular task form, or choose to apply the same generation logic to create a task form for the selected task only. Users have the ability to extend the default form generation templates in designer to create fully customized templates. Node that in the case of the Designer meta editor for forms, generating forms will overwrite existing forms for the process and user tasks. In the case of Form Modeler form generation, a merging algorithm is applied when generating.
When selecting a task, users have the ability to edit the selected tasks form via the form button shown above the user task node.
When editing forms, users are asked to choose between the Form Modeler and the Designer in-line meta editor. If the user selects Form Modeler the form is shown in a new asset tab separately from Designer. Designer meta editor is in-line and part of the Designer application.
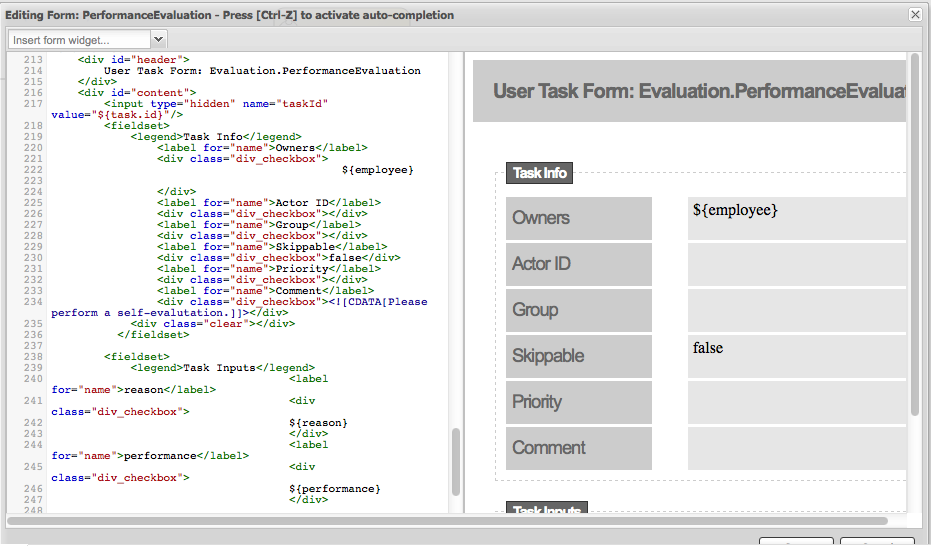
The Designer in-line meta form editor is a powerful text-based editor with a live preview feature as well as auto-completion on process variables and user task data inputs/outputs.
(19) Process Information Sharing - this section includes many functions that help with sharing information of your model. These include:
Share process image - generates a stand-alone HTML image tag which contains a Base64 encoded image source of the current model on the canvas. This link can be shared to team members or other parties and embedded in any HTML content or email that allows HTML content embedding.
Share process PDF - generates a stand-alone HTML object tag which contains a Base64 encoded PDF source of the current model on the canvas. This can similarly be shared and embedded in any HTML content.
Download process PNG - generates a PNG image of the current process on the drawing board which users can download and share.
Download process PDF - generates a PDF of the current process on the drawing board which can be downloaded and shared.
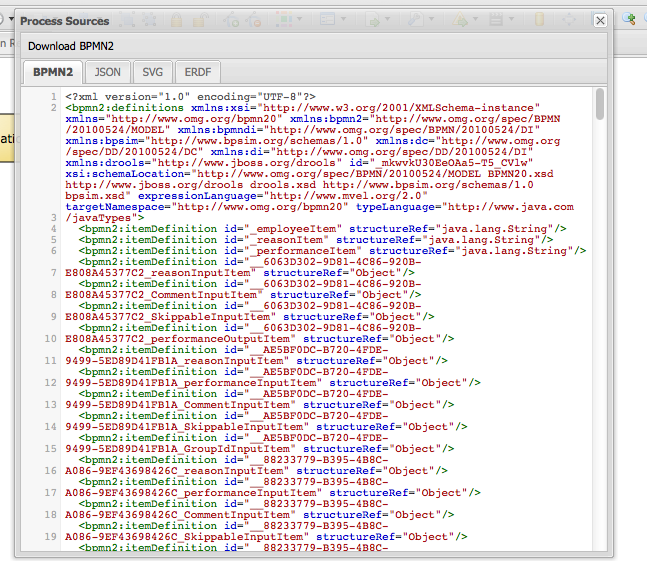
View Process Sources - displays the current process sources in various formats, namely BPMN2, JSON, SVG, and ERDF. Also has the option to download the BPMN2 sources.
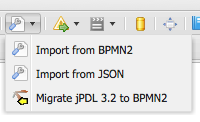
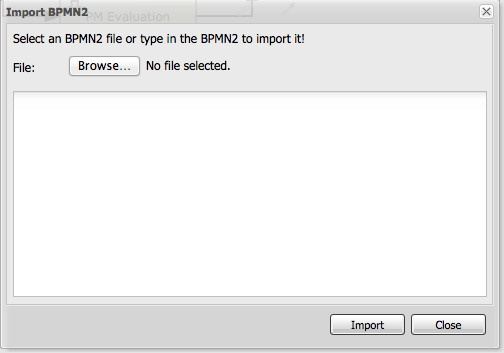
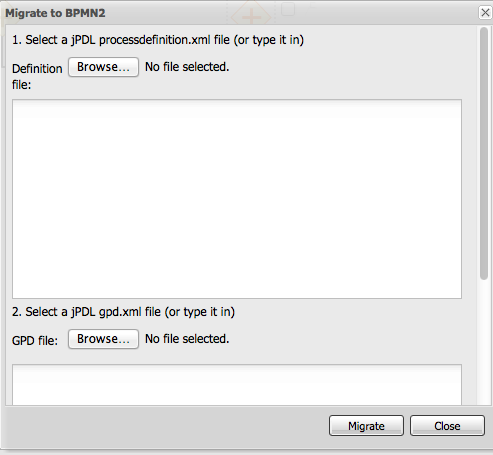
(20) Extra tooling - this section allows users to import their existing BPMN2 processes into designer as well as be able to migrate their old jPDL based processes to BPMN2. For BPMN2 or JSON imports users can choose to add the import ontop of the existing model on the drawing board or choose to replace the current one with the import.
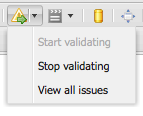
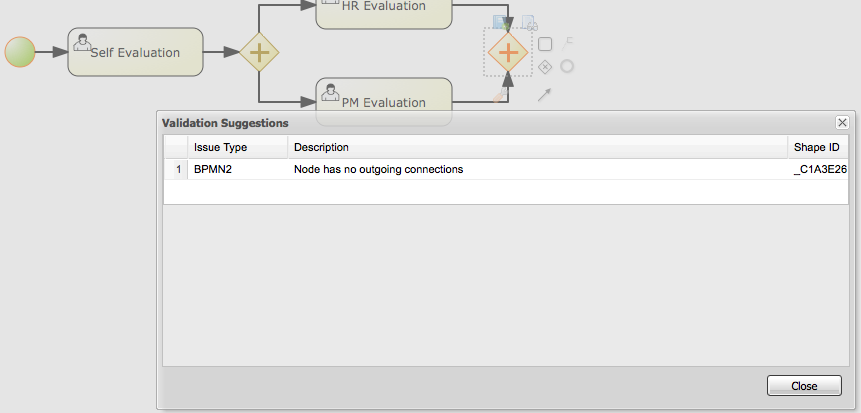
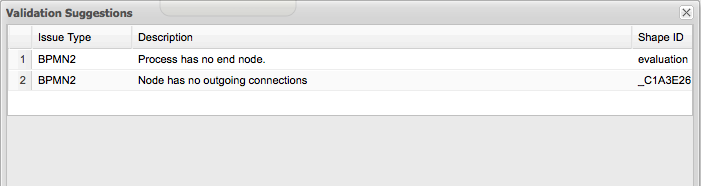
(21) Visual Validation - Designer includes over 100 validation checks and this list is growing. It allows users to view validation issues in real-time as they are modelling their business process. Users can enable visual validation, disable it, as well as view all validation issues at once. If Visual Validation is turned on, Designer with set the shape border of shapes that do not pass validation to red color. Users can then click on that particular shape to view the validation issues for that particular shape only. Alternatively "View All Issues" present a combined list of all validation errors currently found. Note that you do not have to periodically save your business process in order for validation to update. It will do so on its own short intervals during modelling. Users can extend the list of validation issues to include their own types of validation on certain elements of their business model.
(22) Process Simulation - Business Process Simulation deals with statistical analysis of process models over time. It's main goals include
Pre-execution and post-execution optimization
Reducing the risk of change in business processes
Predict business process performance
Foster continuous improvements of performance, quality and resource utilization of business processes
Designer includes a powerful simulation engine which is based on jBPM and Drools and a graphical user interface to view and interpret simulation results. In addition users are able to view all process paths included in their current model on the drawing board. Designer Process Simulation is based on the BPSim 1.0 specification. Details of Process Simulation capabilities in Designer are can be found in its Simulation documentation chapter. Here we just give a brief overview of all features it contains.
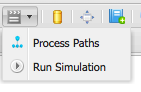
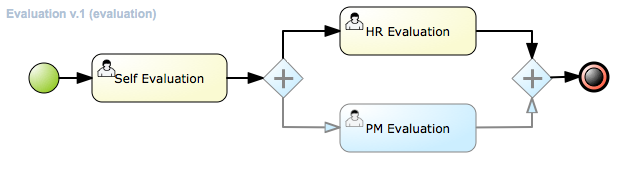
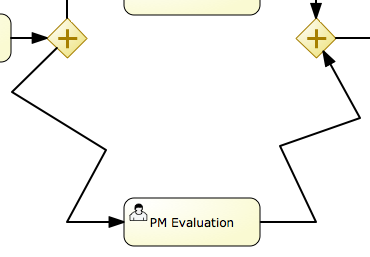
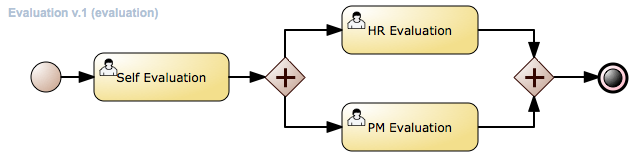
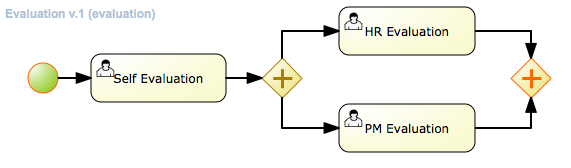
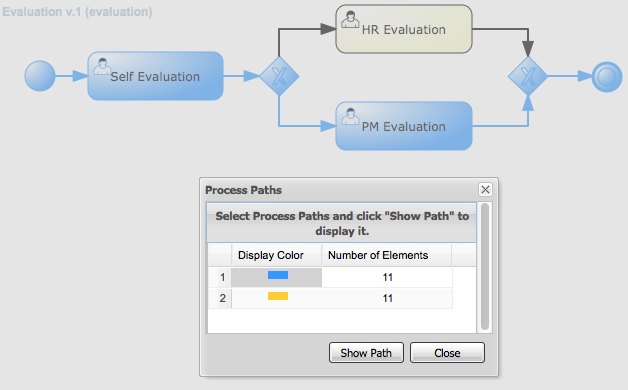
When selecting Process Paths, the simulation engine find all possible paths in the business model. Users can choose certain found paths and choose to display them. The chosen path is marked with given colors as shown below.
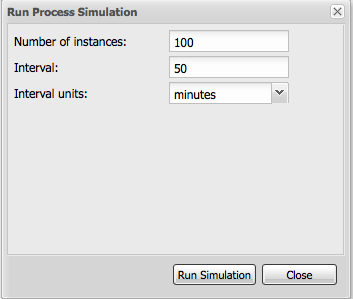
When selecting "Run Simulation", users have to enter in simulation runtime properties. These include the number of instances of this business process to simulate and the interval time and units. This interval is the time in-between consecutive simulation.
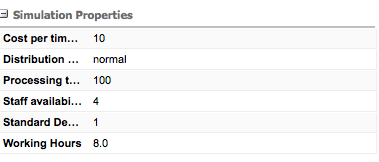
Each shape on the drawing board includes Simulation properties (properties panel) where users can set numerous simulation properties for that particular shape. More info on each of these properties can be found in the Simulation chapter of the documentation.
Designer pre-sets some defaults for new processes, which allows business processes to be simulated by default without any modifications of these properties. Note however that the results of the default settings
may not be optimal or targeted for the users particular needs.
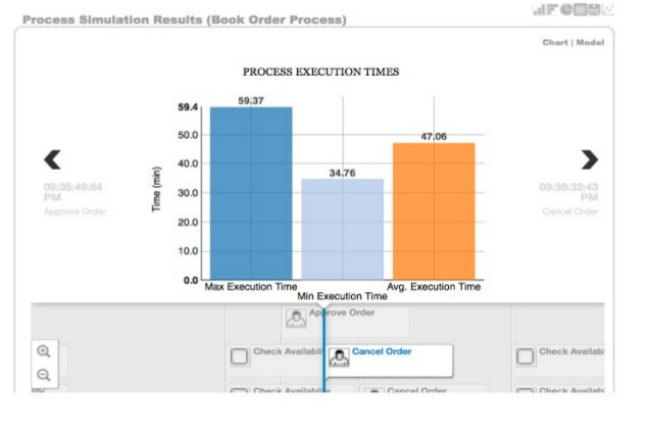
Once the simulation runtime has completed, users are shown the simulation results in the "Simulation Results" tab of Designer. The results default to the process results. Users can switch to results for each particular shape in their business process to see more specific detauls. In addition,
the results contain process paths simulation results for each path in the business process.
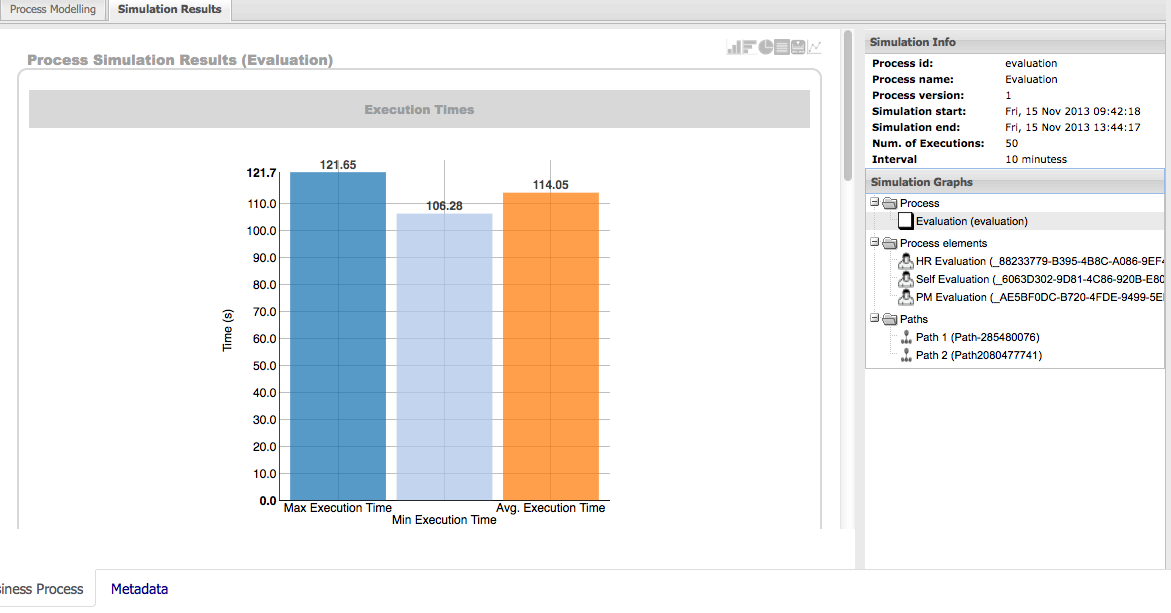
Designer simulation presents the users with many different chart types. These include:
Process results: Execution times, Activity instances, Total cost
Human Task results: Execution times, Resource Utilization, Resource Cost
All other nodes: Execution times
Process Paths: Path Execution
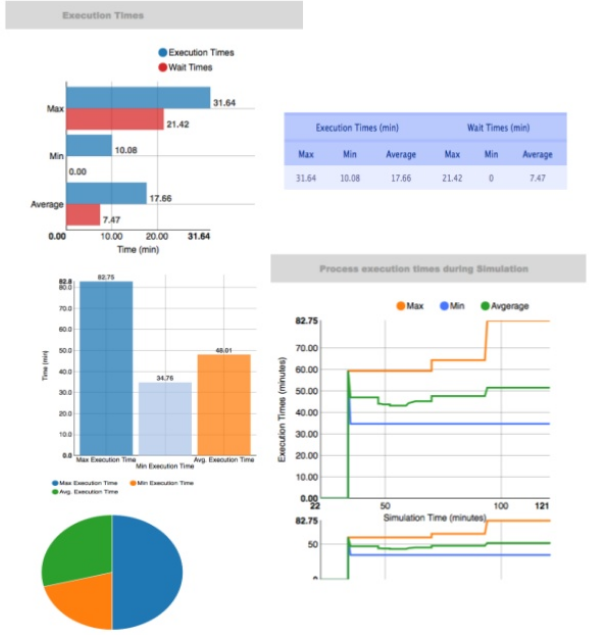
The below image shows a number of possible chart types users can view after process simulation has completed.
In addition to the chart results, Designer simulation also offers a full timeline display that includes all details of what happened during simulation. This timeline allows users to navigate through each
event that happened during process simulation and select a particular node to display results at that particular point in time.
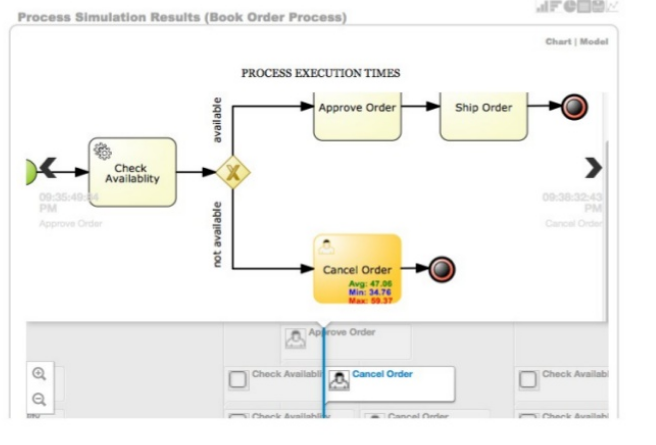
The simulation timeline can be switched to the Model view. This view displays the process model with the currently selected node in the timeline highlighted. The highlighted node displays the simulation results at that particular point in time of the simulation.
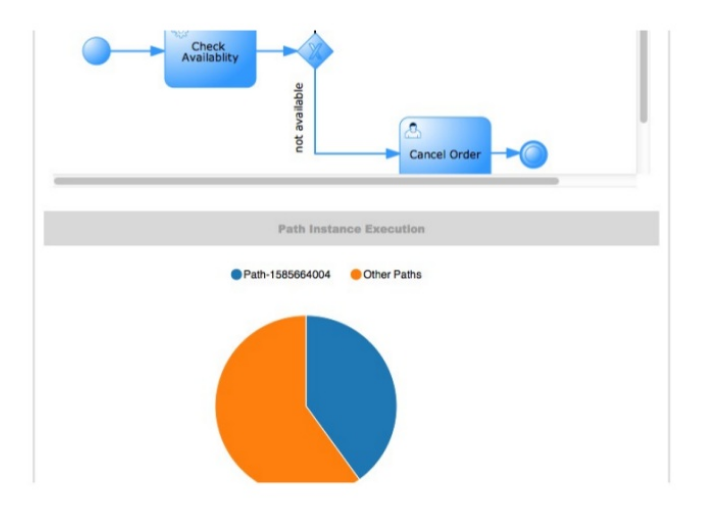
Path execution results shows a chart displaying the chosen path as well as path instance execution details.
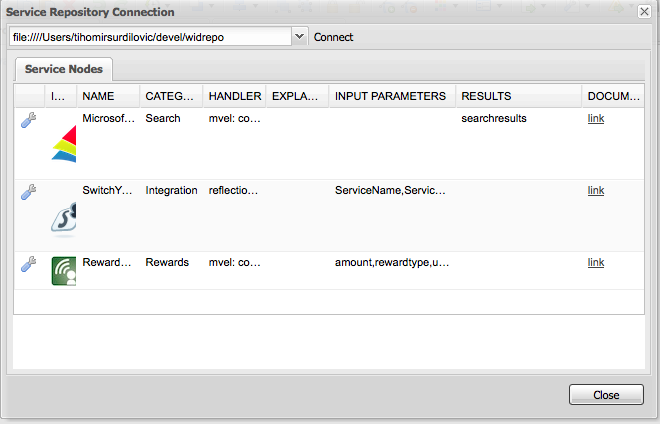
(23) Service Repository - Allows users to connect to a service repository via its URL and see the list of available services it provides. Each of the listed services can then be installed into the users project by clicking on the "wrench" icon next to each listed service. Installing a service does the following things:
- Installs the service configuration (wid) into the users Workbench project. This can later be editor via the Workitem Definitions Editor.
- Installs the service icon (defined in the service configuration) and if one does not exist a default one will be provided.
- Installs the service maven dependencies into the project POM.
- Installs the service default handler into the project Deployment Descriptor.
Users will be notified when the service is successfully installed. After the install users have to re-open the business process to be able to start using the installed services.
(24) Full screen Modev - allows users to place the drawing board of Designer into full-screen mode. This can help with better visualizing larger business processes without having to scroll. Note that this feature is possible only if your browser has full screen mode capabilities. If it does not designer will show a message stating this to the user.
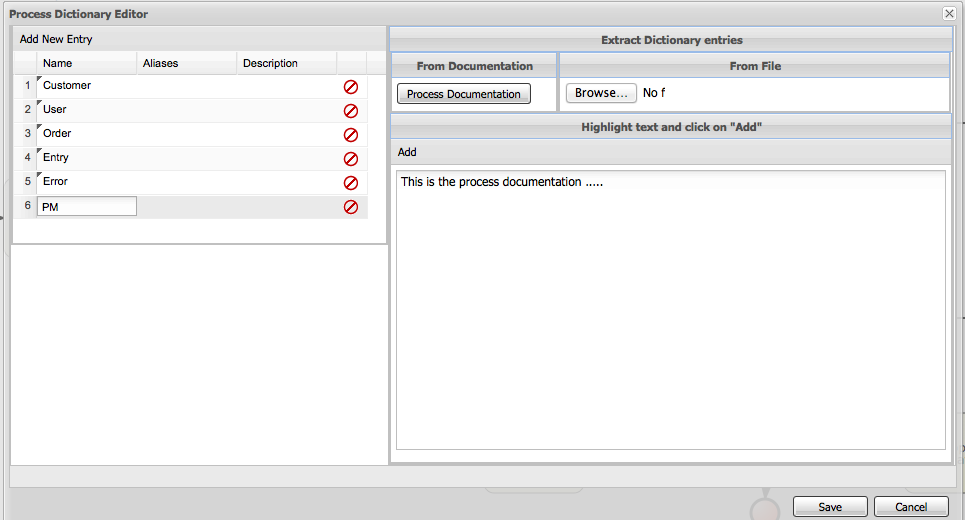
(25) Process Dictionary - Designer Dictionary Editor allows users to create their own dictionary entries or harvest from process documentation or business requirement documents. Process Dictionary entries can be used as auto-completion for shape names. This will be expanded in the future versions to allow mapping of node patters to specific dictionary entries as well. Users can add entries to the dictionary in the Dictioanry Editor or from the selected shapes directly.
(26, 27, 28, 29) Zooming - zooming allows users to zoom in/out of the model, zoom in/out back to the original setting as well as zoom the process model on the drawing board to fit the currently dimensions of the drawing board.